> For the complete documentation index, see [llms.txt](https://developer.emporix.io/llms.txt). Markdown versions of documentation pages are available by appending `.md` to page URLs; this page is available as [Markdown](https://developer.emporix.io/import-tool/dashboard.md).
# Dashboard
Monitor Import Tool health, run outcomes, and stream freshness from the Dashboard. Set thresholds that determine whether streams are healthy or unhealthy.
The Dashboard is the first view when you open the Import Tool perspective. It summarizes import volume, success and failure rates, stream health, and activity over a selected time range so you can spot issues without opening each import.
{% hint style="info" %}
Import Tool domain tools are available when you create or edit an AI agent. See [AI Agents](/import-tool/ai-agents.md).
{% endhint %}
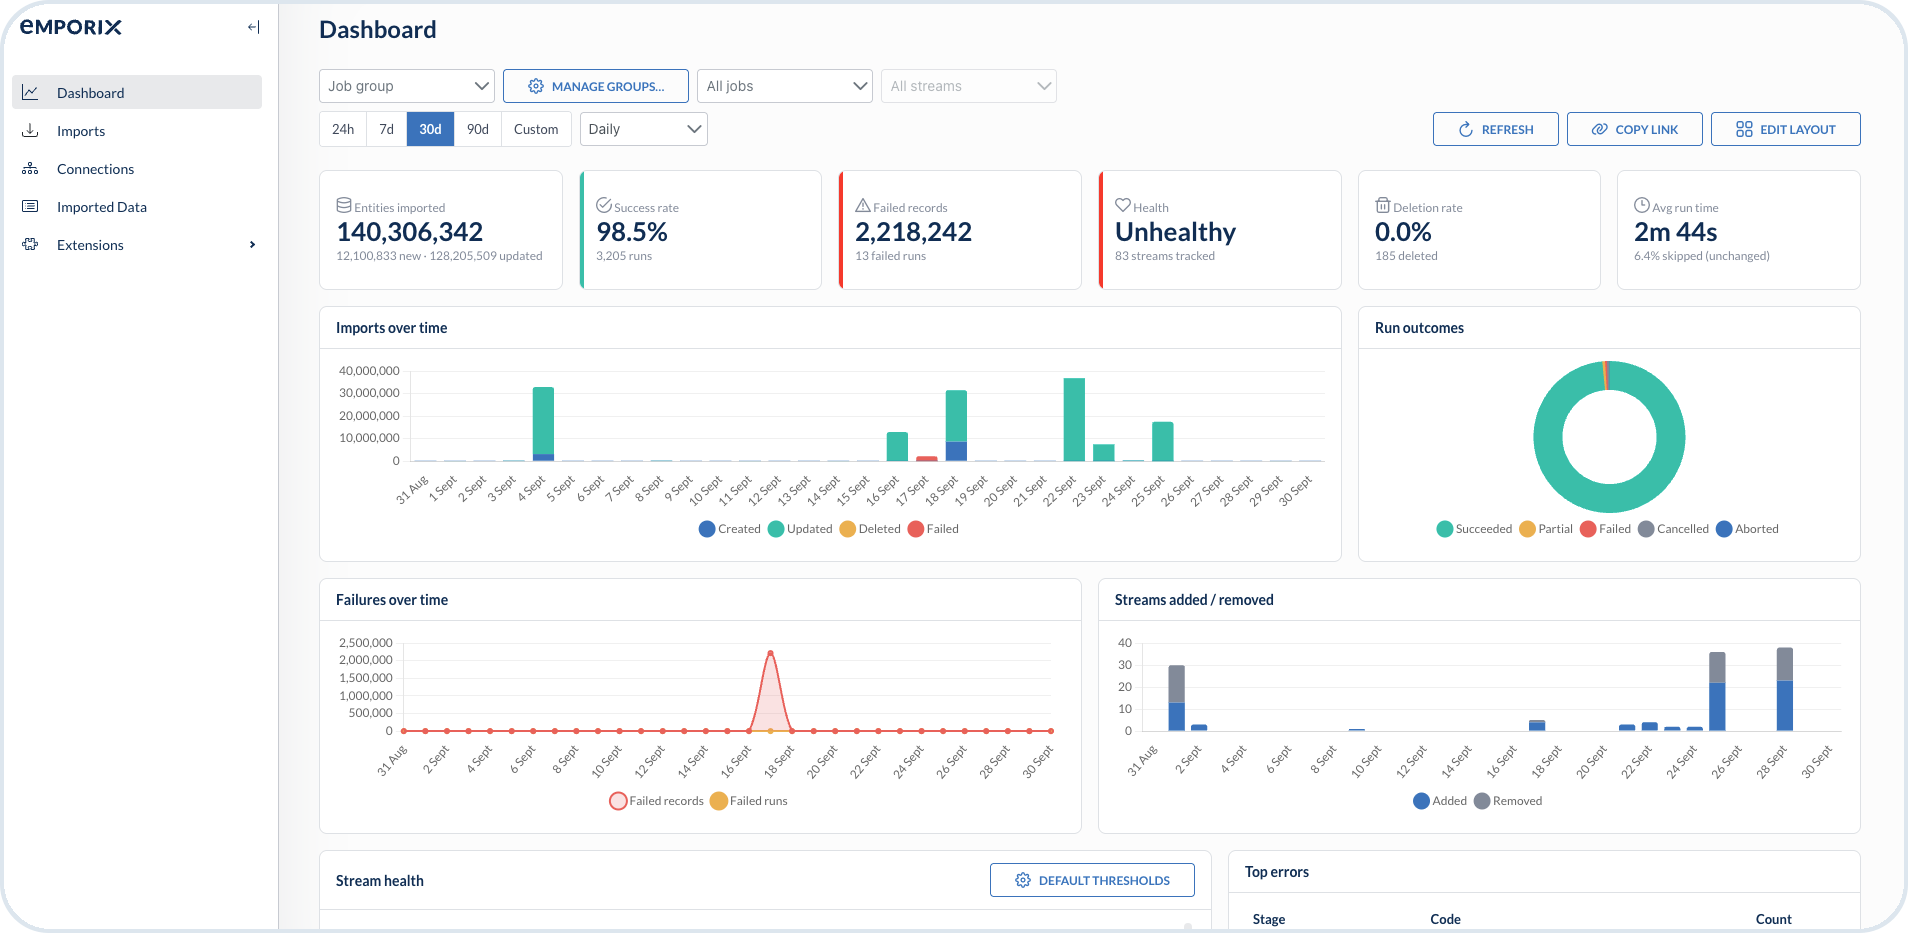
Dashboard with job and stream filters, KPI cards, and import charts
## Filters and layout
At the top of the Dashboard you can narrow the view and share or refresh it:
* **Job group** – filter by a job group. Create and maintain job groups in **Manage groups...**.
* **Jobs and streams** – restrict the metrics to selected imports or streams, or leave **All jobs** and **All streams**.
* **Time range** – choose **24h**, **7d**, **30d**, **90d**, or **Custom**.
* **Frequency** – choose how the charts group data in the selected range: **Daily**, **Weekly**, or **Monthly**.
* **Refresh** – reload your import metrics.
* **Copy link** – copy a link to the current filtered view.
* **Edit layout** – rearrange the dashboard widgets to suit your needs.
## KPI cards
The summary cards show tenant-wide results for the selected filters and time range:
| Card | What it shows |
| --------------------- | ---------------------------------------------------------------------------- |
| **Entities imported** | Total imported entities, with a breakdown of new versus updated records |
| **Success rate** | Percentage of successful runs in the selected period |
| **Failed records** | Records that failed, with the number of failed runs |
| **Health** | Overall health for tracked streams, for example **Healthy** or **Unhealthy** |
| **Deletion rate** | Percentage of records deleted during imports |
| **Average run time** | Average duration of runs, with a note on skipped or unchanged records |
{% hint style="info" %}
See [Health review and thresholds](#health-review-and-thresholds) for default thresholds and stream overrides.
{% endhint %}
## Charts
Below the KPI cards, the Dashboard shows:
* **Imports over time** – stacked volume of created, updated, deleted, and failed entities.
* **Run outcomes** – distribution of succeeded, partial, failed, cancelled, and aborted runs.
* **Failures over time** – failed records and failed runs across the selected range.
* **Streams added / removed** – how many streams were added or removed.
Use these charts to correlate spikes in volume with failures or with streams that recently changed.
## Health review and thresholds
The stream health widgets show data from recent runs, data freshness, and failure rates. The error table groups the most frequent errors by stage and error code, for example **UPSERT** or **EXTRACT**, with codes such as `STREAM_ERROR`.
**Source field health** identifies source-data and composite relationship issues:
* **Repeated keys** – source records that use the same resolved key
* **Unresolved parents** – composite child records that could not be linked to a parent record
Use the stream's [Key resolution](/import-tool/import-setup-and-jobs/imports/configuring-streams.md#key-resolution) and [Composite](/import-tool/import-setup-and-jobs/imports/configuring-streams.md#composite) settings to investigate these counts.
Open the related import from **Imports** when a stream is unhealthy. Use **Run history**, [Imported Data](/import-tool/import-setup-and-jobs/imported-data.md), and the stream configuration to identify the cause. See [Imports](/import-tool/import-setup-and-jobs/imports.md) and [Streams](/import-tool/import-setup-and-jobs/imports/streams.md).
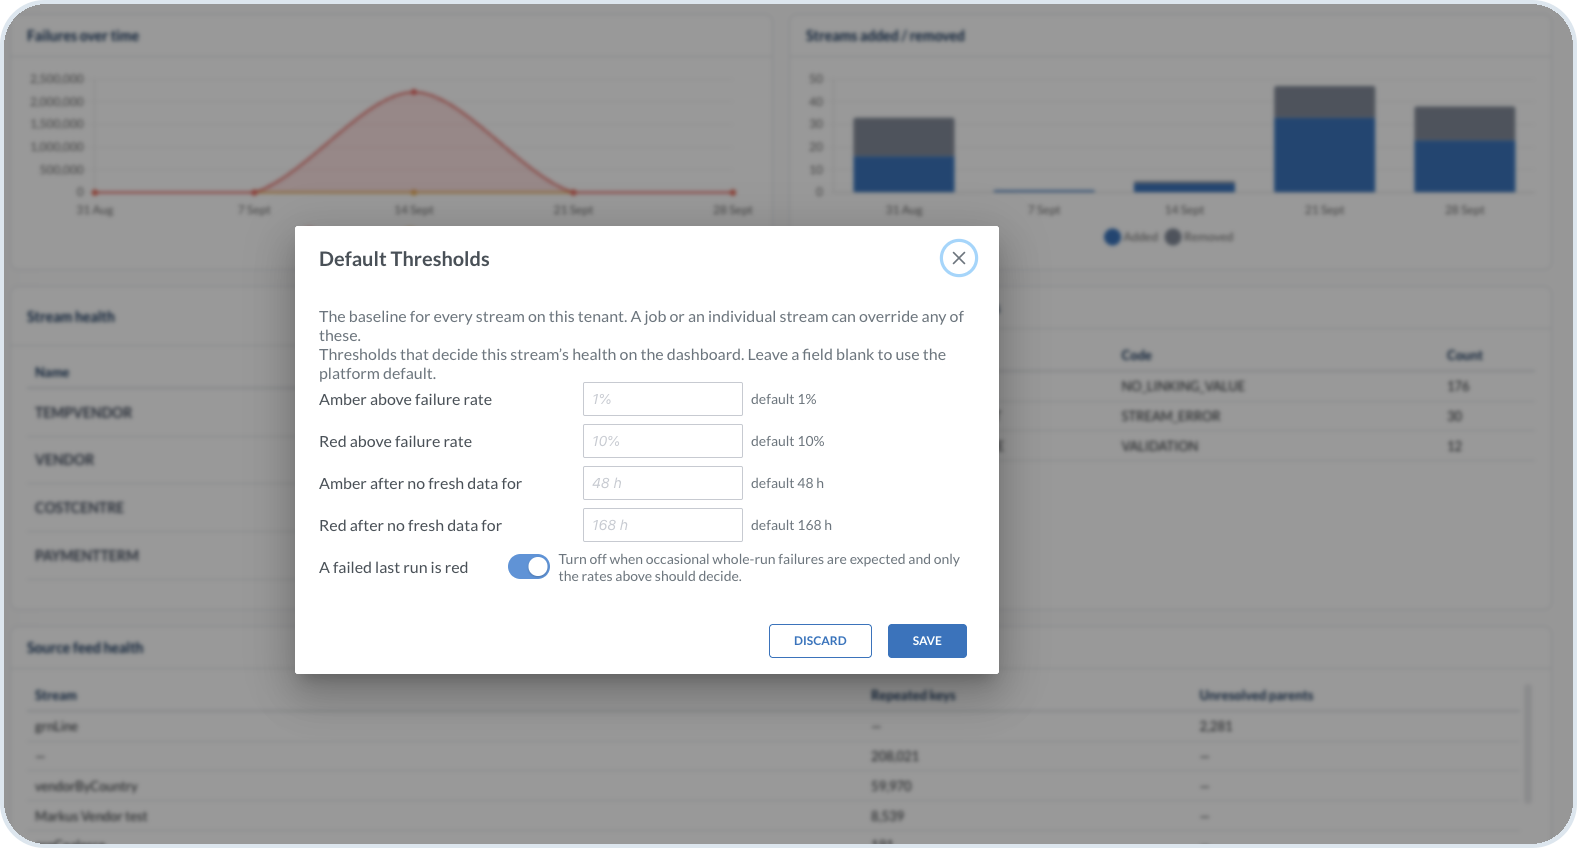
Health status is based on failure rate, freshness, and whether the last run failed. Select **Default thresholds** to alter the tenant baseline thresholds. An import or stream can override the thresholds. Leave a field blank to keep the platform default.
Default thresholds for stream health, with the stream health table and error breakdown in the background
| Setting | Platform default | Purpose |
| --------------------------------- | ---------------- | ------------------------------------------------------------------------------------------------------------------------------------- |
| **Amber above failure rate** | 1% | Warning threshold for failed records |
| **Red above failure rate** | 10% | Unhealthy threshold for failed records |
| **Amber after no fresh data for** | 48 h | Warning when a stream has not imported fresh data |
| **Red after no fresh data for** | 168 h | Unhealthy when a stream has not imported fresh data |
| **A failed last run is red** | On | Treat a failed last run as red. Turn this off when occasional whole-run failures are expected and only the rates above decide health. |
{% hint style="info" %}
To override the tenant defaults for one stream, use its **Health** tab. See [Stream health](/import-tool/import-setup-and-jobs/imports/configuring-streams.md#stream-health).
{% endhint %}
---
# Agent Instructions
This documentation is published with GitBook. GitBook is the documentation platform designed so that both humans and AI agents can read, navigate, and reason over technical content effectively. Learn more at gitbook.com.
## Querying This Documentation
If you need additional information that is not directly available in this page, you can query the documentation by asking a question.
Perform an HTTP GET request on the following URL with the `ask` and `goal` query parameters:
```
GET https://developer.emporix.io/import-tool/dashboard.md?ask=&goal=
```
`ask` is the immediate question: it should be specific, self-contained, and written in natural language.
`goal` is what the user is ultimately trying to achieve, the reason they need the answer. Sharing it helps GitBook give you a better, more relevant answer. A goal is most helpful when it describes the outcome the user wants rather than restating the question. For example, with `ask=how do I create an API token`, a goal like `automate deployments from our CI pipeline` lets GitBook tailor the answer to that use case.
The response will contain a direct answer to the question and relevant excerpts and sources from the documentation.
Use this mechanism when the answer is not explicitly present in the current page, you need clarification or additional context, or you want to retrieve related documentation sections.