> For the complete documentation index, see [llms.txt](https://developer.emporix.io/llms.txt). Markdown versions of documentation pages are available by appending `.md` to page URLs; this page is available as [Markdown](https://developer.emporix.io/agentic-commerce-intelligence/agentic-intelligence/logs.md).
# AI Logs
Check the logs related to the workings of your AI Agents.
The **AI Logs** view lets you monitor and control everything related to the AI Agents enabled in your tenant.
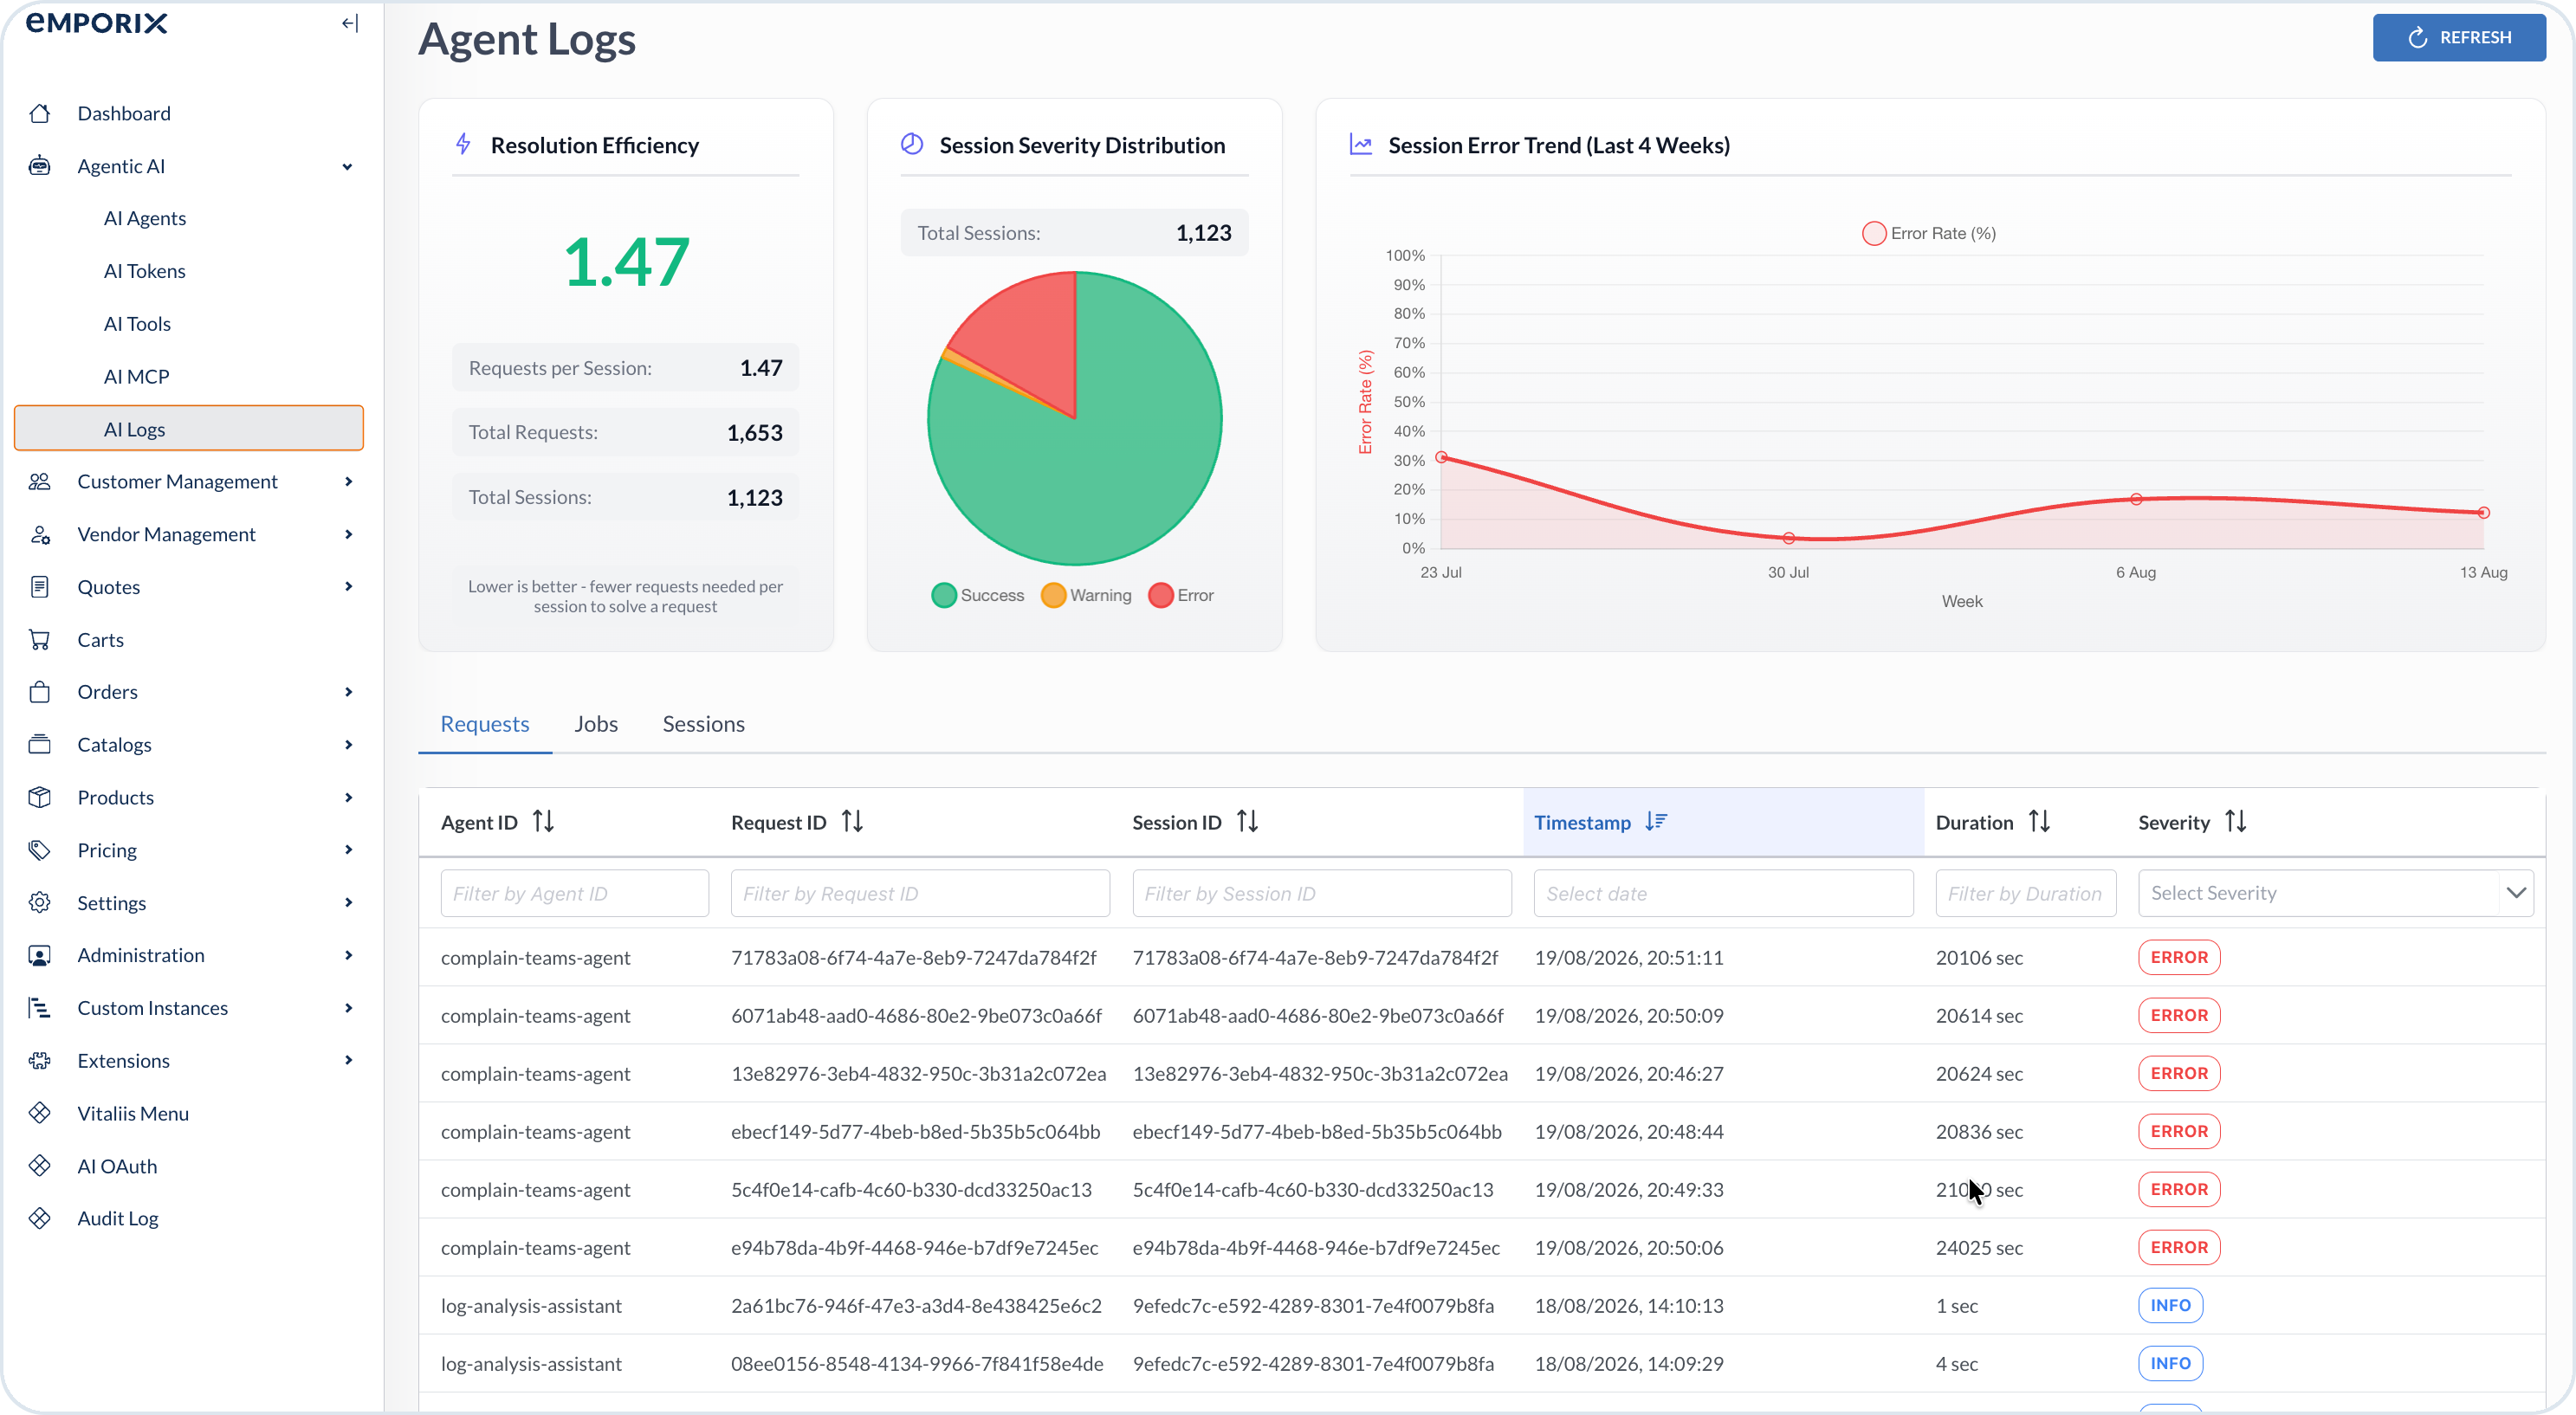
The dashboard provides clear visual tools to measure agent efficiency, track session handling, and analyze errors so you can iterate on your agents with confidence.
AI Logs
You can also access logs related to a particular AI agent directly from the **AI Agents** view:
AI Agent Logs
The available charts give you quick insight into AI Agents effectiveness:
* **Resolution Efficiency** highlights total AI requests and sessions.
* **Session Severity Distribution** summarizes session outcomes.
* **Session Error Trend** shows error rates over the last four weeks.
The logs are grouped into [requests](#requests), [jobs](#jobs), and [sessions](#sessions). For deeper insight into agent behavior, open the logs dedicated to a specific component or agent. Use search and the available filters in each view to find a specific log entry.
Each log entry is marked with the highest applicable severity: info, warning, or error. This means that if a given entry (request, job or session) contains an info and an error, it is marked with the error flag.
Switch to each tab to dig into the details.
## Requests
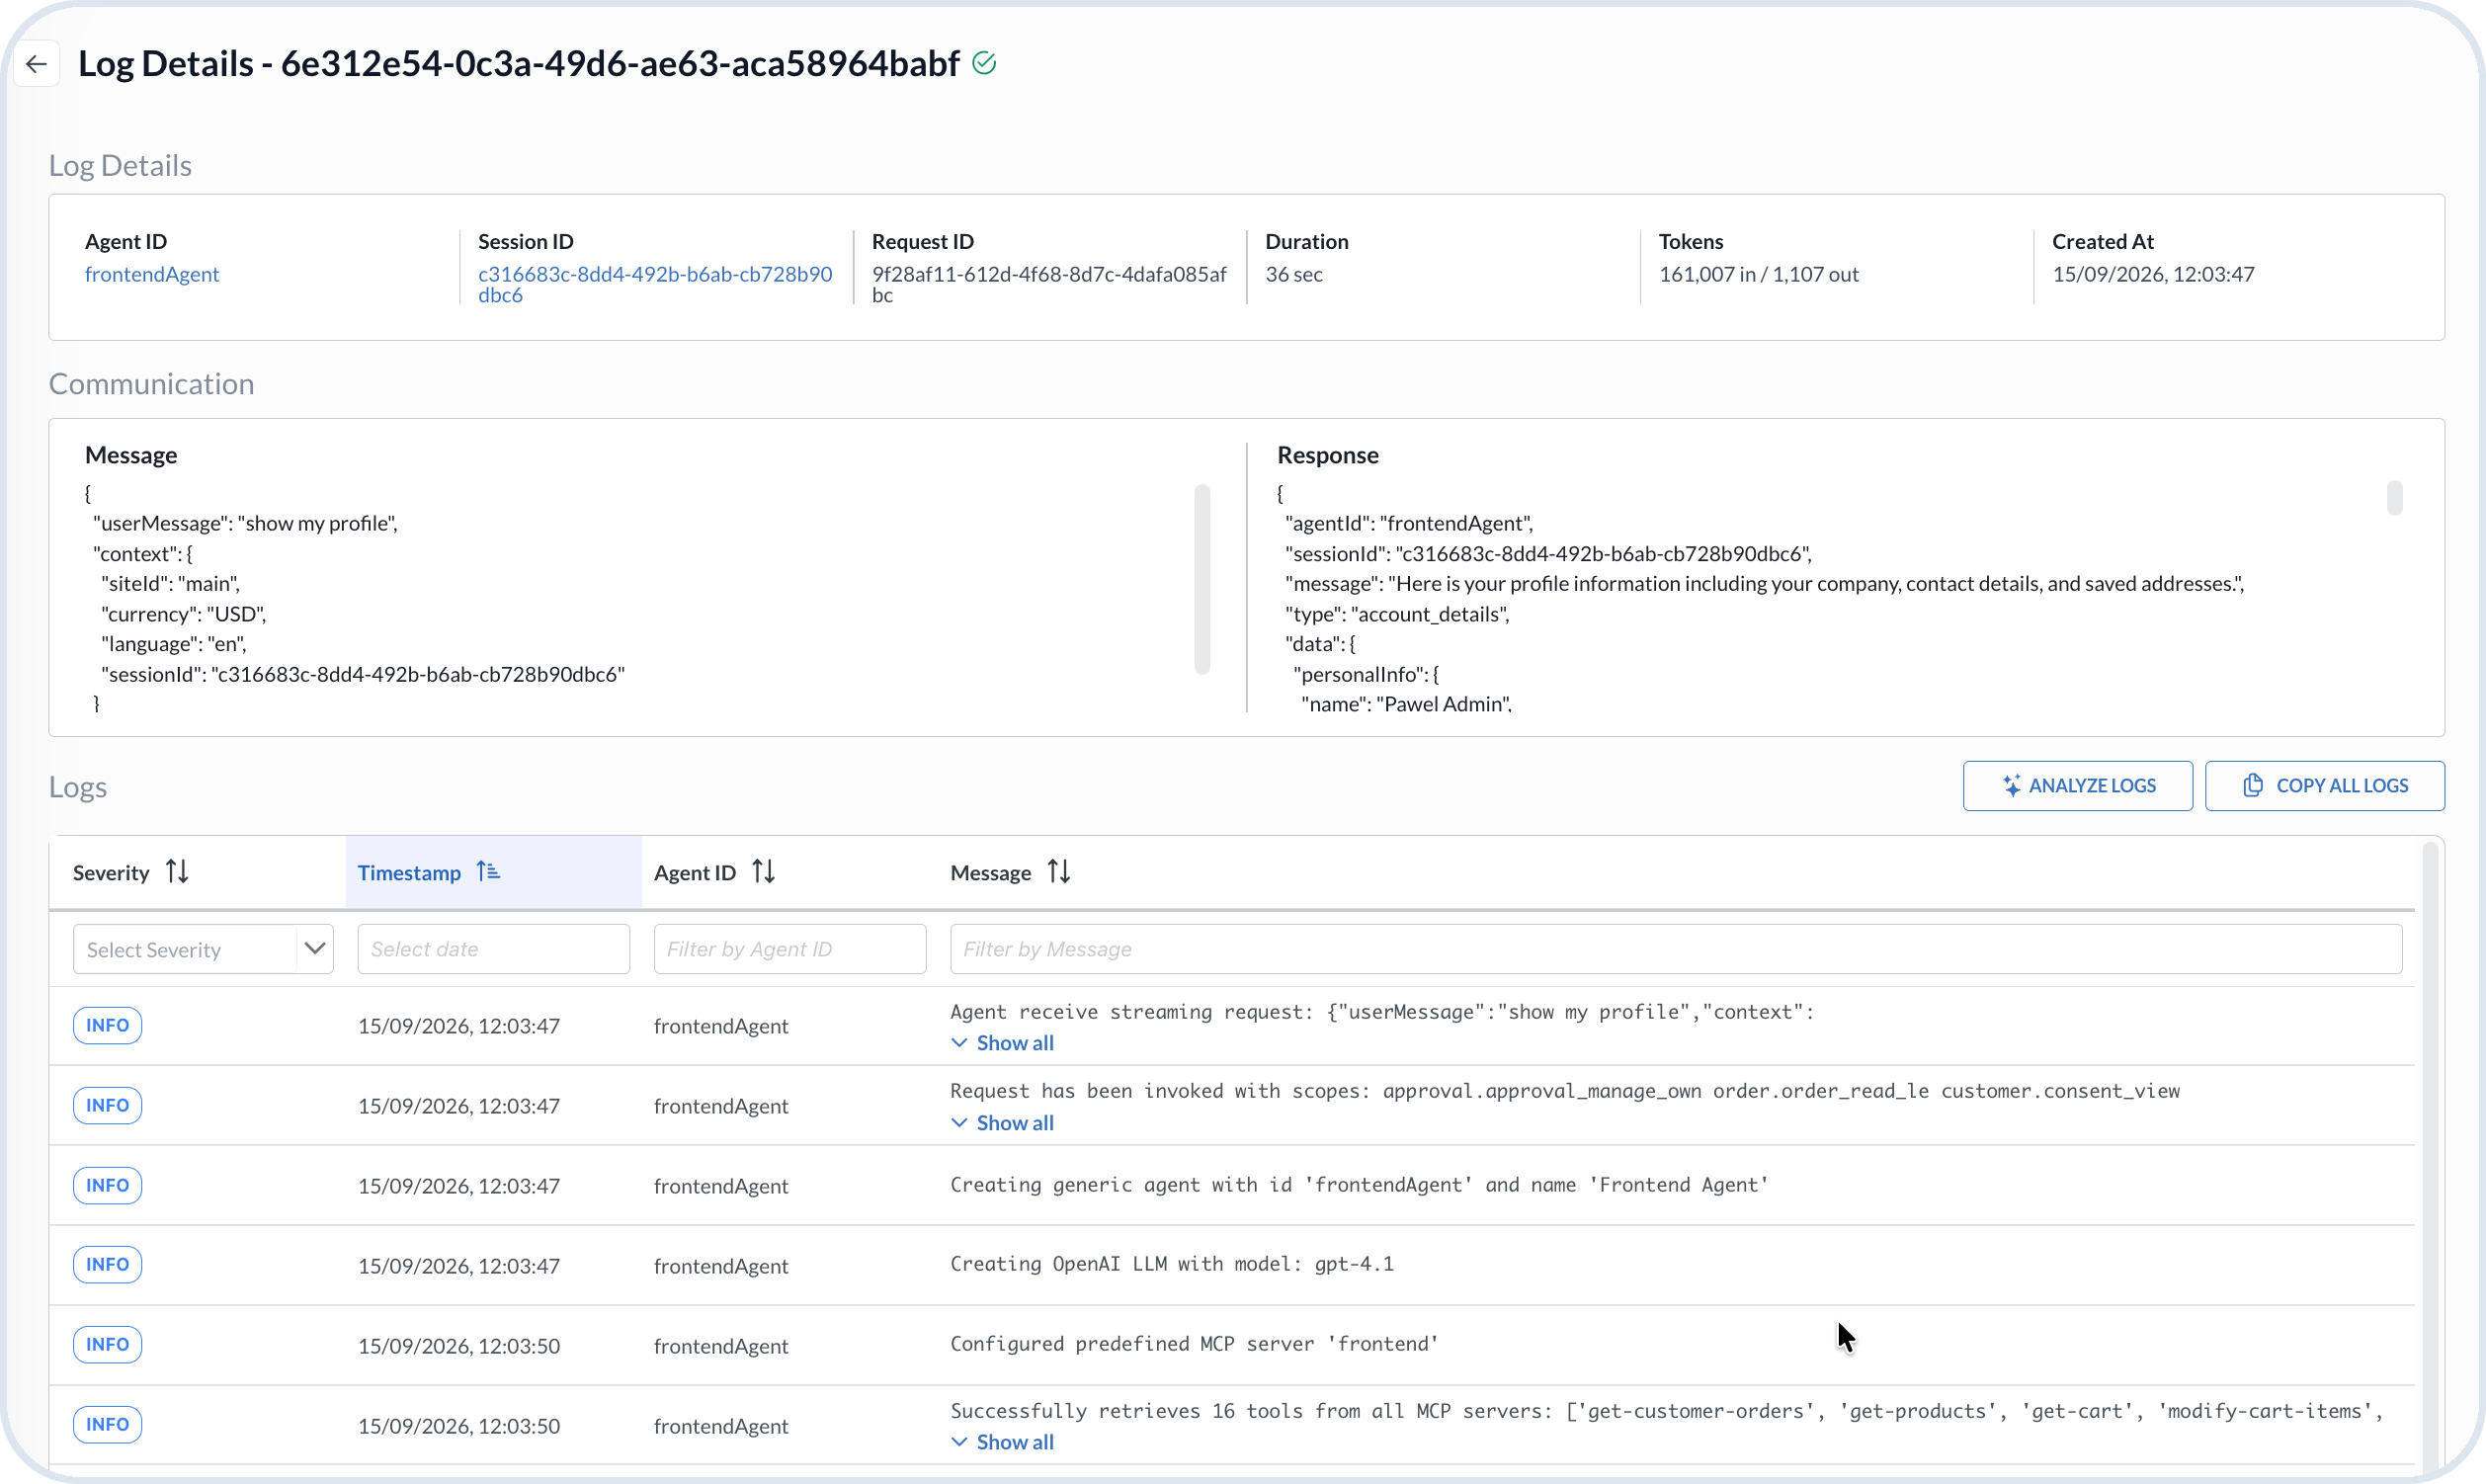
The **Requests** view lists every request involving AI Agents. Open an entry to inspect **Log Details**, including the related metadata, the message and response, and the system log.
Request log details
The **Log Details** view provides basic information about a specific entry:
* **Agent ID** – The identifier of the agent that handled the request.
* **Session ID** – The identifier of the session this request belongs to.
* **Request ID** – The identifier of this request.
* **Duration** – The time the request took to complete.
* **Tokens** – The number of tokens consumed by the request.
* **Created At** – The timestamp when the request was registered.
Select **Agent ID** or **Session ID** to open the related agent or session.
The **Communication** panel shows the incoming message and the agent's response.
The **Logs** table lists system events for the request. The **Agent ID** column shows the version of the agent that wrote the entry, for example `complaint (v1)`. Entries without version information show the agent ID only. To review or restore an agent version, see [AI Agent Versions](/agentic-commerce-intelligence/agentic-intelligence/agent-versions.md).
Use the filters to find a specific entry. From here, you can also select **Copy All Logs** to copy the log entries to the clipboard.
Select **Analyze Logs** to start a conversation with the [Agentic Log Analysis Assistant](/agentic-commerce-intelligence/agentic-intelligence/agent-library/log-analysis-agent.md). The assistant lets you investigate the logs or look for a specific event.
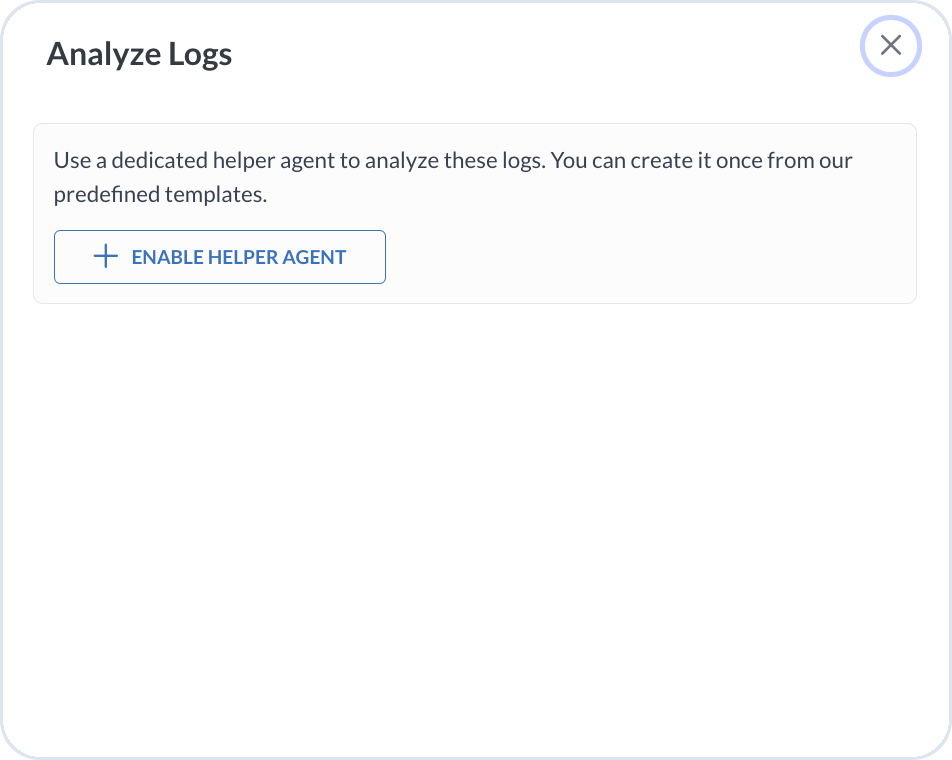
If the assistant is not enabled yet, the first time you select **Analyze Logs**, you are prompted to enable the helper agent from the predefined template. Select **Enable Helper Agent** to create it. You can also enable it from the **Predefined Agents** list in the AI Agent Library. Once enabled, the agent remains available in the library.
Enabling the helper agent for log analysis
After the helper is enabled, **Analyze Logs** opens a conversation modal. The assistant reviews the log messages, and you can ask follow-up questions directly in the conversation.
{% hint style="warning" %}
Output from this assistant is generated by AI and can be wrong or incomplete. Verify the findings before you act on them.
{% endhint %}
Analyze Logs conversation
## Jobs
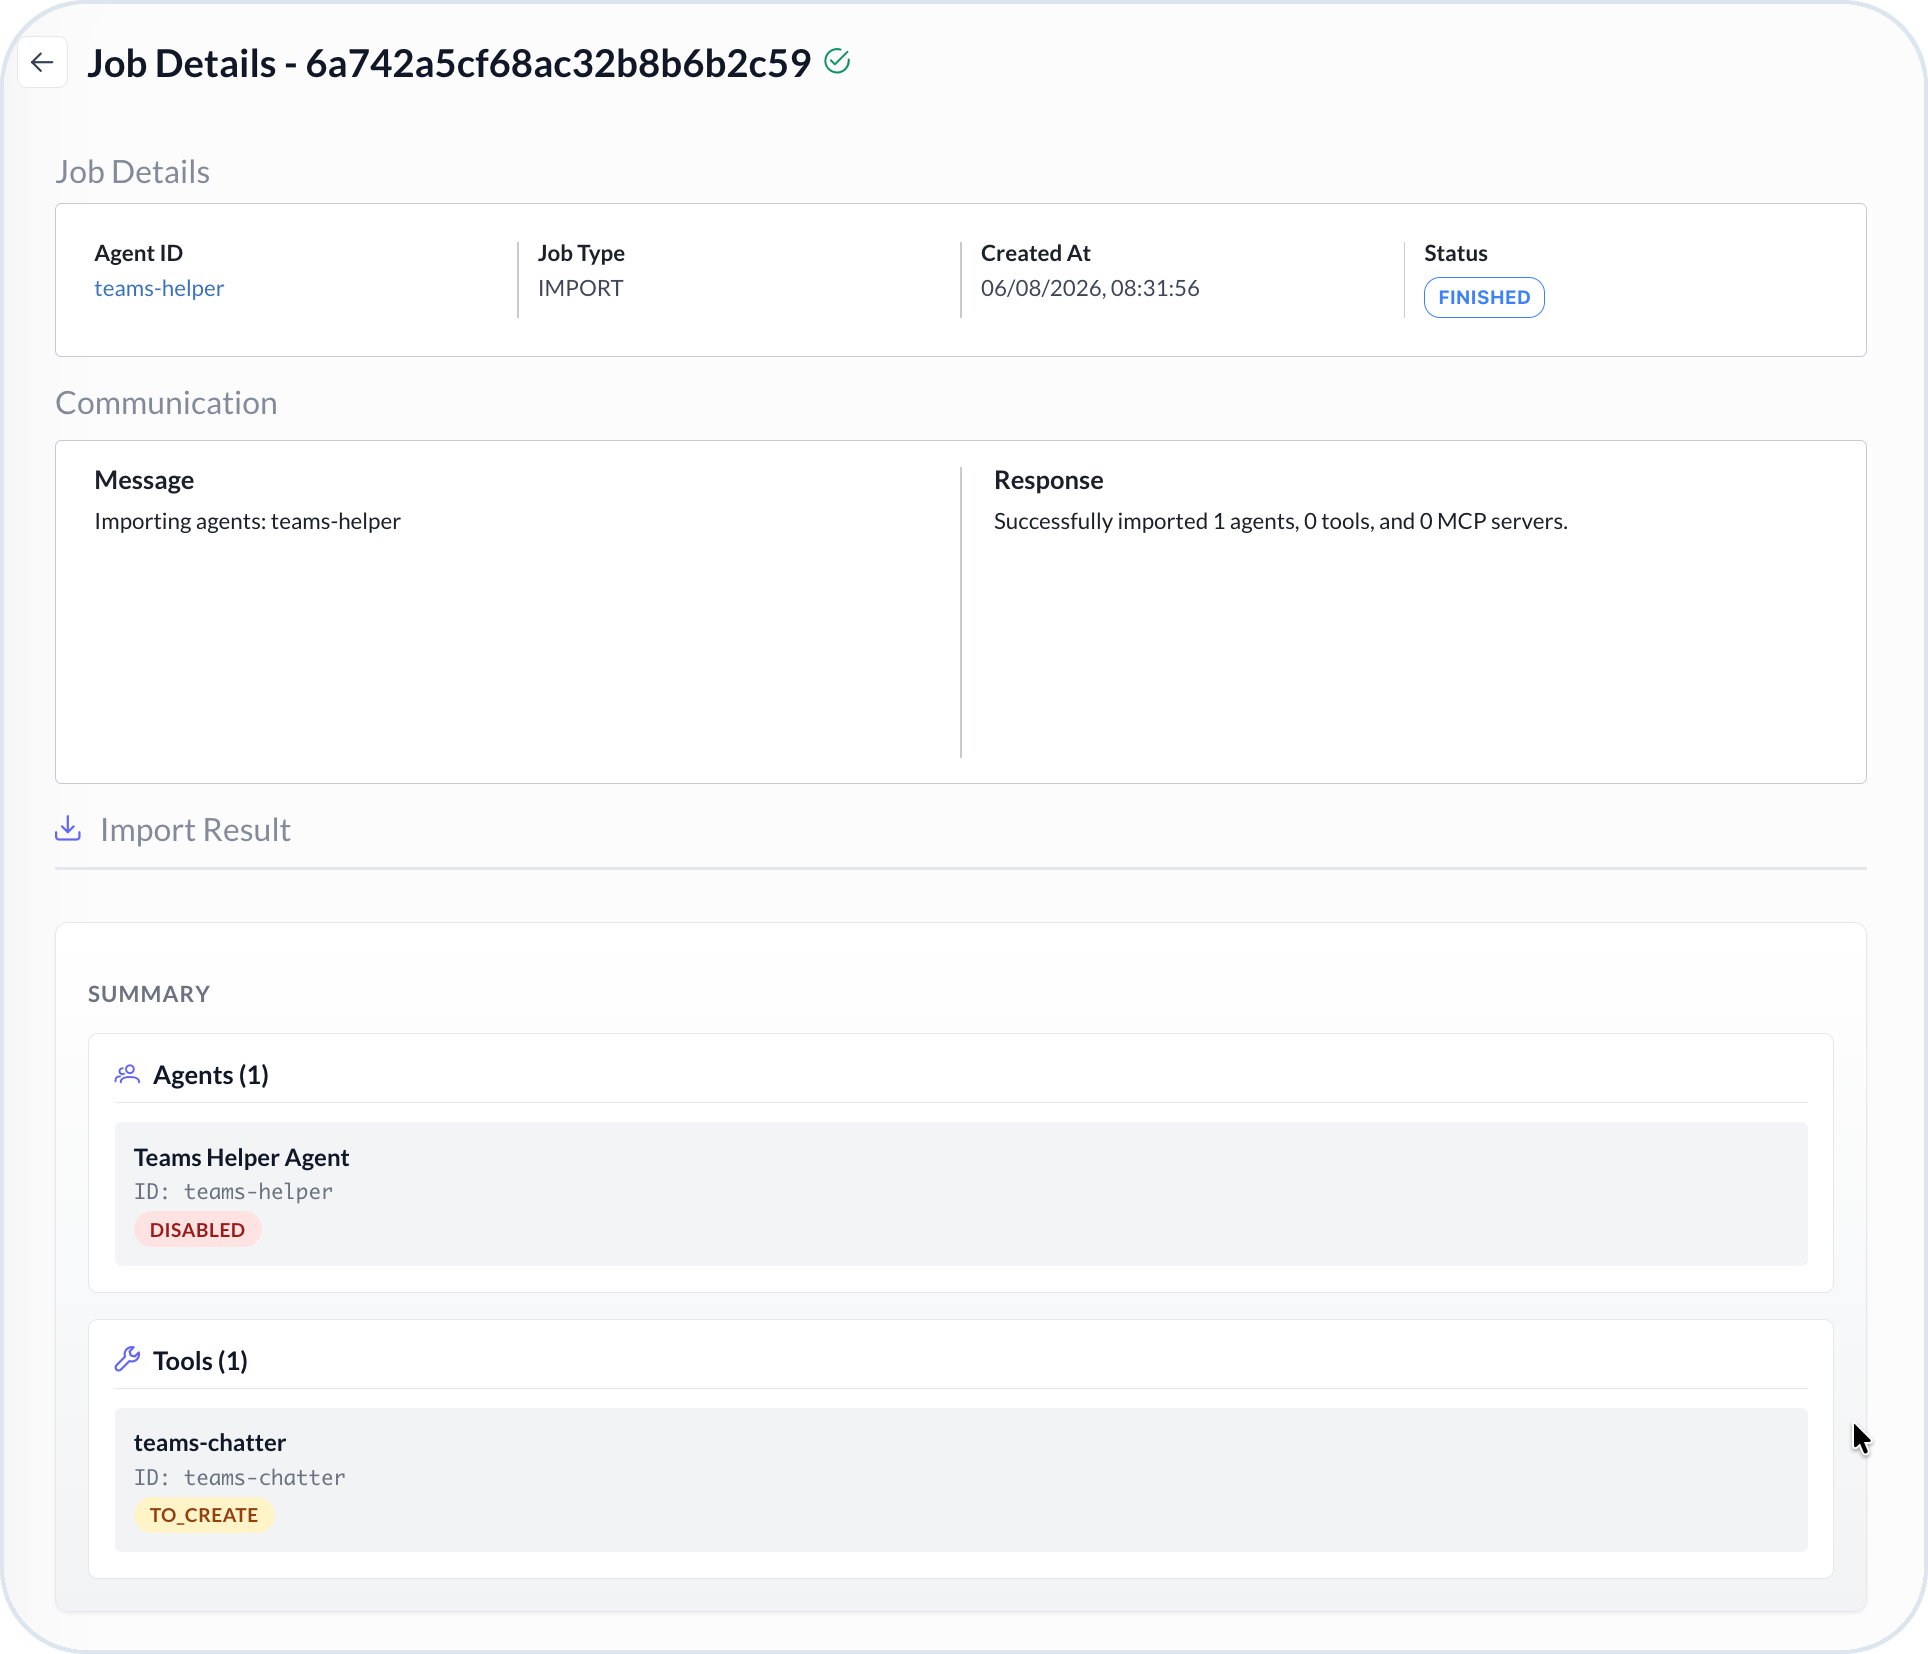
The **Jobs** view captures system actions related to AI Agents, such as agent chat, import, or export operations. Open an entry to inspect **Job Details** and understand what succeeded, what failed, and why.
Job Details
The **Job Details** view provides basic information about a specific entry:
* **Agent ID** – The identifier of the agent related to the job. You can directly open the agent.
* **Request ID** – The identifier of the request related to the job (for agent chat only).
* **Job Type** – The kind of system action, such as import, export, or agent chat.
* **Duration** – The time the job took to complete (for agent chat only).
* **Created At** – Timestamp when the job was registered.
* **Status** – The current state of the job, for example **Finished**.
The **Communication** panel shows the job message and the system response.
For import jobs, the **Import Result** section summarizes what was created or reused. It lists agents, tools, and MCP servers with their IDs and status, such as **Disabled** or **To create**. For more information about import outcomes, see [AI Agent Import/Export](/agentic-commerce-intelligence/agentic-intelligence/agent-import-export.md).
## Sessions
Use the **Sessions** view to inspect a specific AI session.
{% hint style="success" %}
A **session** starts with the request when an agent is called, and it lasts through any collaboration with other agents or users invoked by this agent. For example, an incorrect invoice complaint triggers the Complaint Agent flow and the request starts a new session, which lasts through the whole agents flow:
1. Request -> Complaint Audit -> Complaint Categorization -> Complaint Agent -> Support Agent
2. Request (Slack or MS Teams message) -> Support Agent
3. Request (second Slack or MS Teams message) -> Support Agent
All steps above are within the same session. For custom agents using a communication tool such as MS Teams, subsequent requests from collaboration participants within the same conversation are also part of the same session. The **Session ID** in this view is the same identifier as the chat `session-id` header and the `sessionId` field in the chat response. The details panel lists the agents that participated in the collaboration.
{% endhint %}
Filter the logs by agent to focus on the relevant conversation. The details panel presents a linear timeline of every agent step, which gives a more business-oriented overview highlighting only the most important logs and all the warnings and errors. Select a card in the session to open the details view of the related log entry or entries.
### Collaboration tool events
When an agent uses a communication tool (Slack or MS Teams), the session timeline includes collaboration-specific events:
* **User mapping failures** – A configured participant could not be matched to a user in the communication platform or could not be added to the conversation. These entries are marked at warning or error severity.
* **Channel creation failures** – The tool could not create or access the configured channel or group chat. These entries are marked at error severity.
* **Inbound messages** – A reply from an identified user in the collaboration channel or group chat, forwarded to the agent that invoked the tool.
* **Unidentified users** – An inbound message from a user who is not configured or recognized on the agentic platform. These entries are marked at warning severity.
Review these events to verify tool instance configuration and inbound handling settings. Conversation records are also stored on the communication tool instance and on the agent's **Conversations** tab. For configuration guidance, see [Communication Tools Configuration](/agentic-commerce-intelligence/agentic-intelligence/configuration/tools/comm-tools.md).
AI Sessions Logs
---
# Agent Instructions
This documentation is published with GitBook. GitBook is the documentation platform designed so that both humans and AI agents can read, navigate, and reason over technical content effectively. Learn more at gitbook.com.
## Querying This Documentation
If you need additional information that is not directly available in this page, you can query the documentation by asking a question.
Perform an HTTP GET request on the following URL with the `ask` and `goal` query parameters:
```
GET https://developer.emporix.io/agentic-commerce-intelligence/agentic-intelligence/logs.md?ask=&goal=
```
`ask` is the immediate question: it should be specific, self-contained, and written in natural language.
`goal` is what the user is ultimately trying to achieve, the reason they need the answer. Sharing it helps GitBook give you a better, more relevant answer. A goal is most helpful when it describes the outcome the user wants rather than restating the question. For example, with `ask=how do I create an API token`, a goal like `automate deployments from our CI pipeline` lets GitBook tailor the answer to that use case.
The response will contain a direct answer to the question and relevant excerpts and sources from the documentation.
Use this mechanism when the answer is not explicitly present in the current page, you need clarification or additional context, or you want to retrieve related documentation sections.