Dashboard

Overview of all active processes for your business.

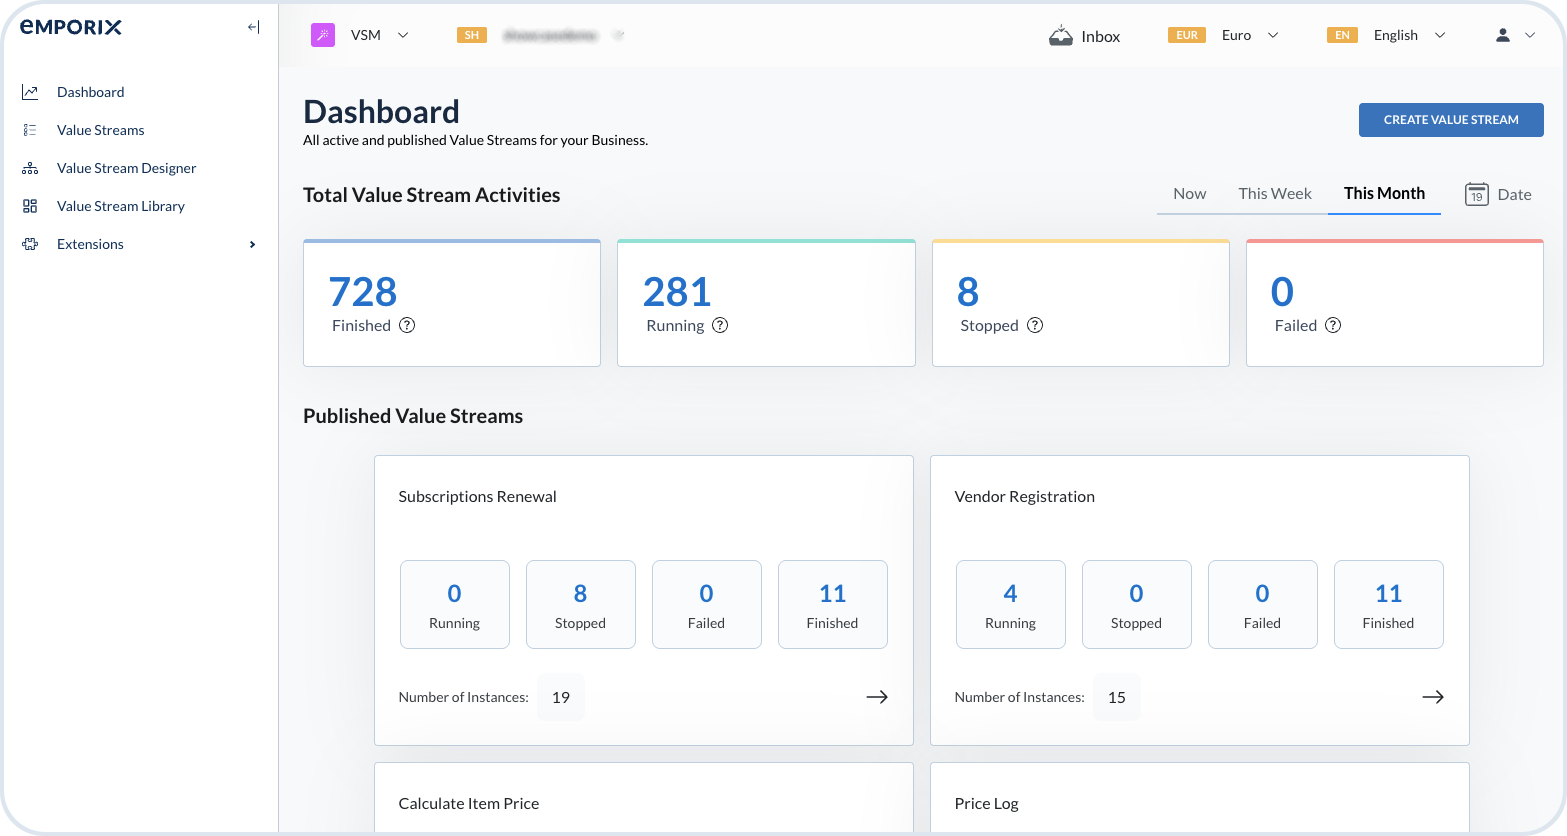
The Dashboard provides a centralized view of all value streams running in your system. It collects and displays real-time data, allowing you to monitor operations, track progress, and quickly identify any issues as they occur.

In this view, you can check the status of specific value streams, get instant visibility into stuck or failed processes, and receive alerts for failed steps. These insights help you pinpoint potential blockers and optimize your process flows more effectively.

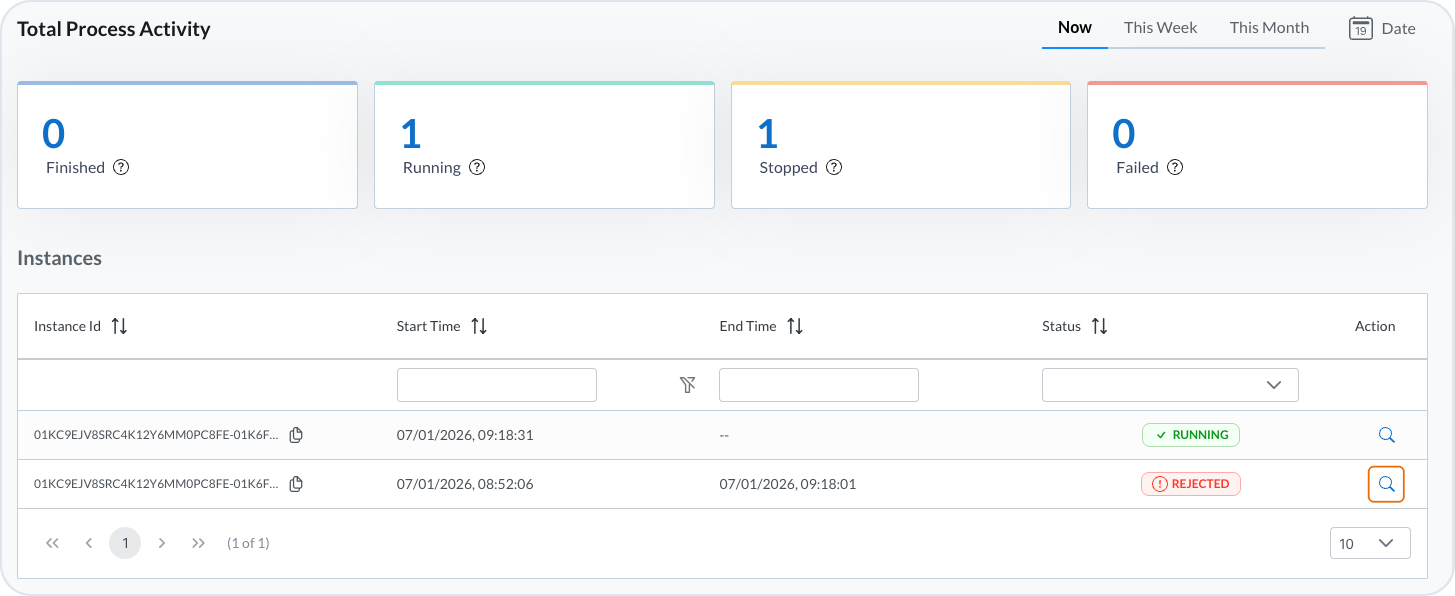
The dashboard presents a clear, organized overview of all your value streams. At the top, you can find summary statistics showing the total number of finished, running, stopped, and failed value streams based on your selected time period. You can view the current situation, see summaries for a week or month, or select a custom date range.

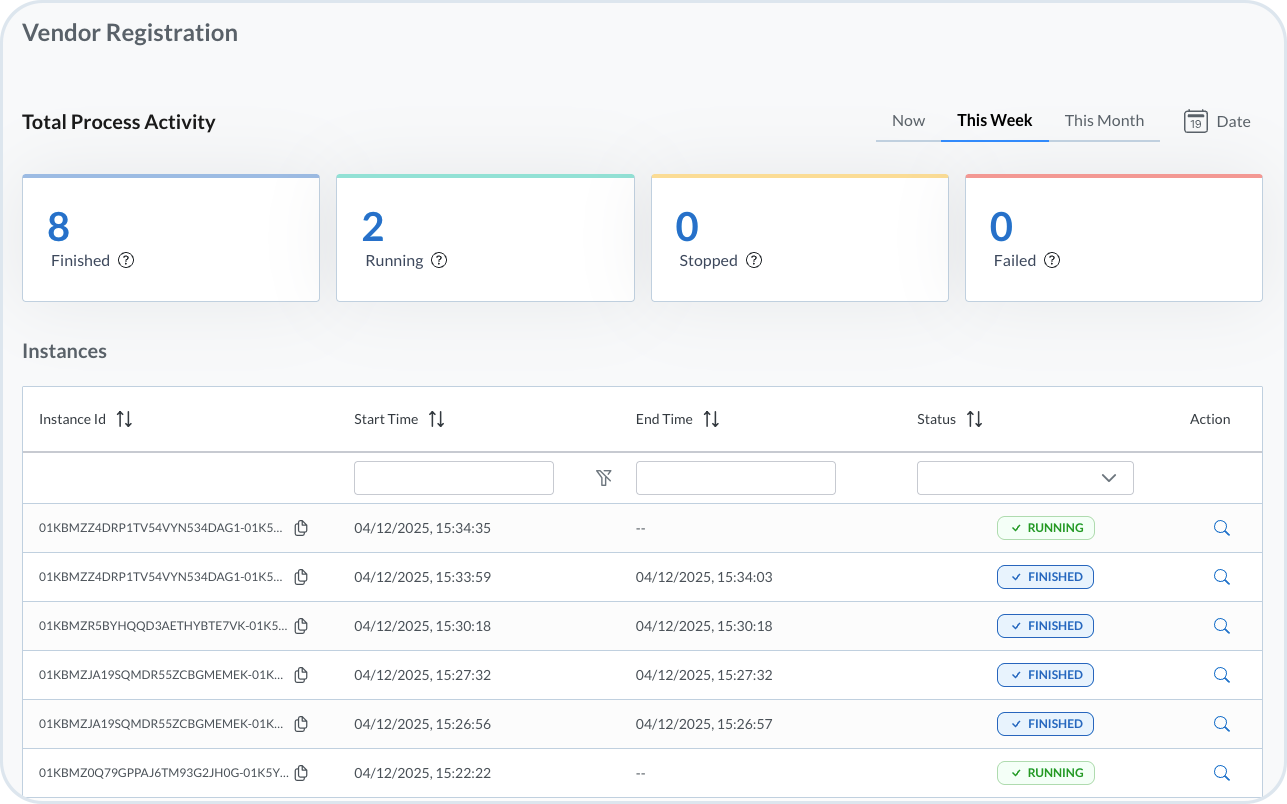
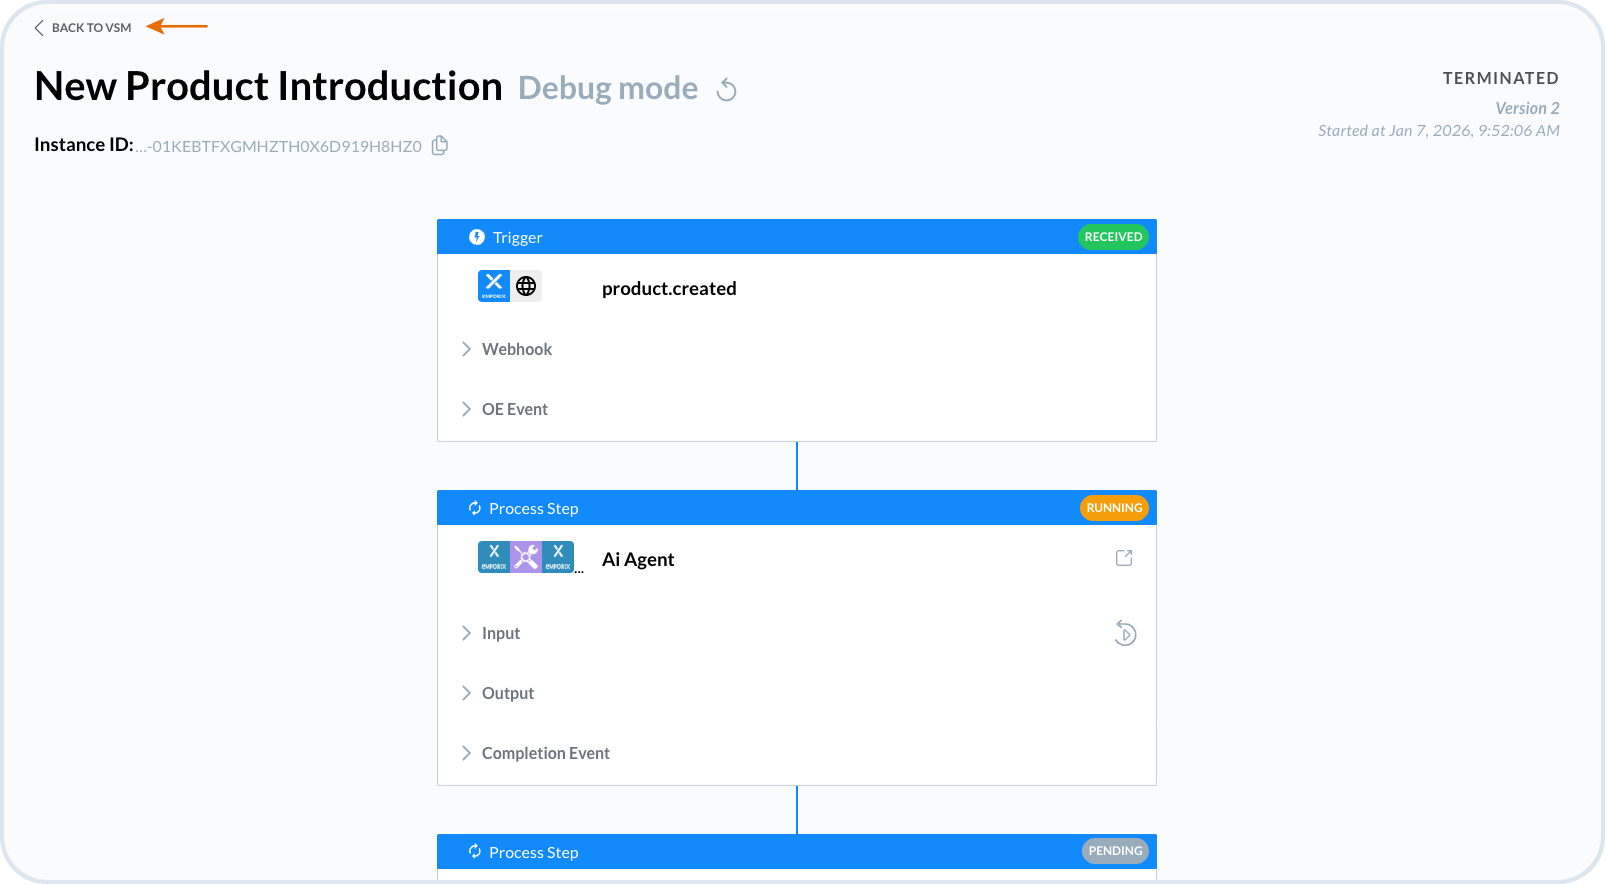
Below the summary statistics, you see individual cards for each published value stream. Each card displays the number of running, stopped, failed, and finished instances for that specific process. Click the arrow icon on any card to expand the view and see a detailed list of all instances with their individual statuses.

Task Inbox

The dashboard includes a Task Inbox icon that provides quick access to tasks requiring human interaction within your value streams.

When you click the Task Inbox icon, you're redirected to the Orchestration Engine (OE) where you can view and manage all tasks assigned to you. The Task Inbox consolidates all workflow tasks in one centralized location, making it easy to see what actions are pending and complete them efficiently. For more details on managing tasks, see the Task Inbox documentation.

Last updated

Was this helpful?